Insights Copilot: implementing AI to get some actual work done
Traditional BI dashboards were powerful but intimidating. This is how a conversational AI assistant replaced a 4-5 day reporting cycle, then how post-launch drop-off data reshaped both its onboarding and its core interaction model.
4-5 days old reporting cycle· 10→1 onboarding clicks· ~20% drop-off per step pre-fix· 5-15 min full Smart Flow report
Overview
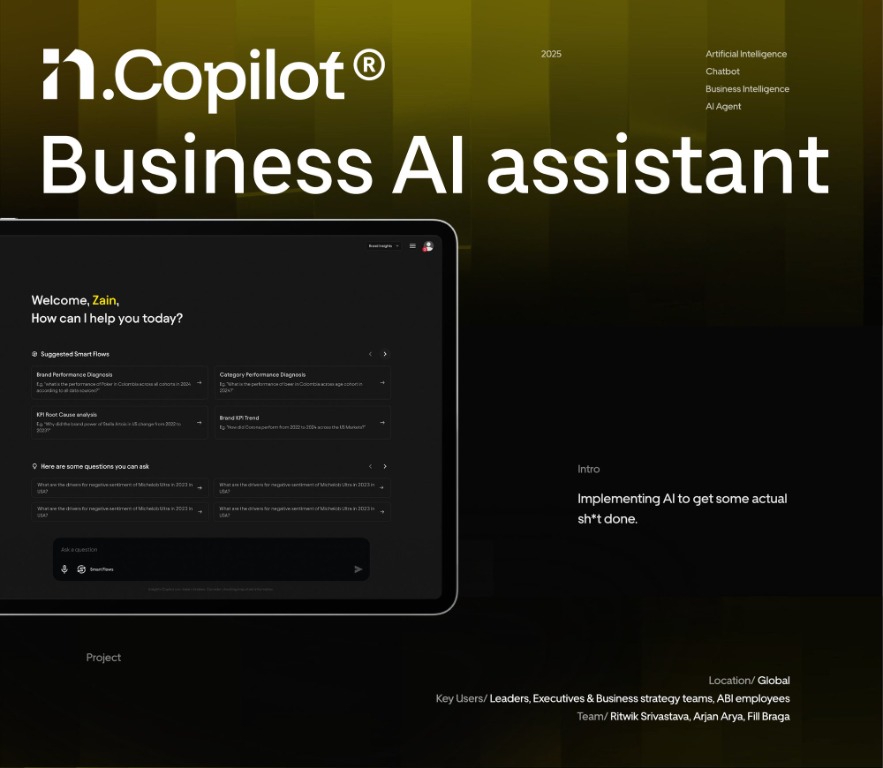
Insights Copilot is an AI-powered conversational assistant built to give non-technical users direct access to business insights, without needing a dashboard, a data analyst, or a multi-day wait.
The problem
How might we simplify access to business insights for non-technical users, while keeping data reliable, contextual, and actionable? Traditional BI dashboards were powerful but intimidating. Most users didn't want complex analytics, they wanted a quick, trustworthy answer.
What it replaced
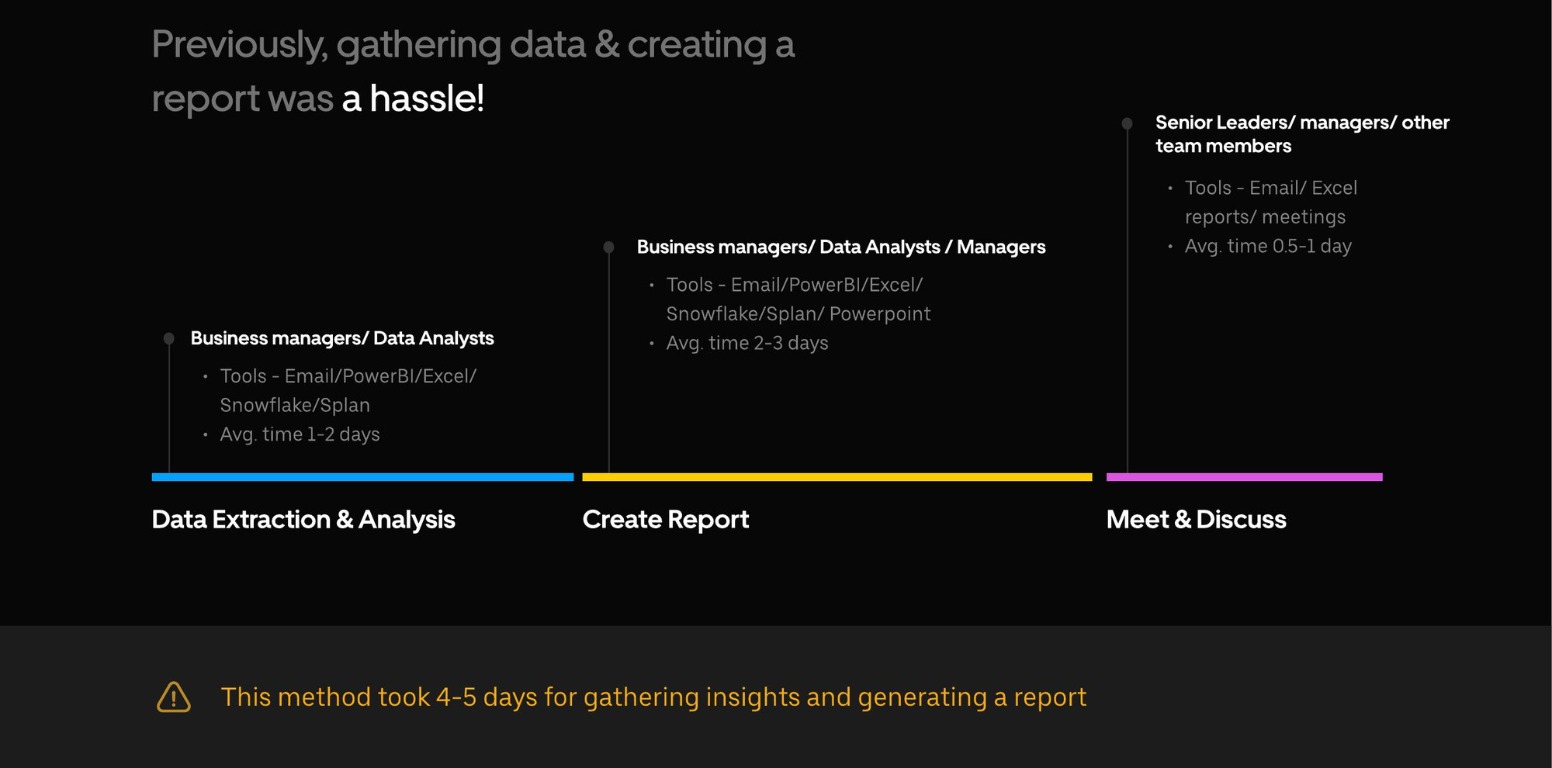
Before Copilot, getting an answer meant a full manual cycle across three different roles, taking 4-5 days end to end.
Data extraction & analysis
Data analysts manually pulled and prepared the underlying numbers.
Create report
Business managers turned the raw analysis into a presentable report.
Meet & discuss
Senior leaders and other stakeholders finally reviewed it together.
Why Conversational
Conversational interaction wasn't chosen for novelty. It solved three specific problems with how people already worked.
- Low activation cost: users already ask questions over email and chat, so a conversational interface removes the friction of learning a new tool.
- Progressive disclosure: data isn't dumped all at once, reducing the cognitive load a user has to carry to get an answer.
- Natural context for all users: when data is presented in plain language with its own context attached, non-technical users onboard faster.

Earning trust in an AI workflow
Users needed enough context and clarity around data sources and assumptions to actually rely on what Copilot told them, not just receive an answer and wonder if it was right.

What happens after the insight?
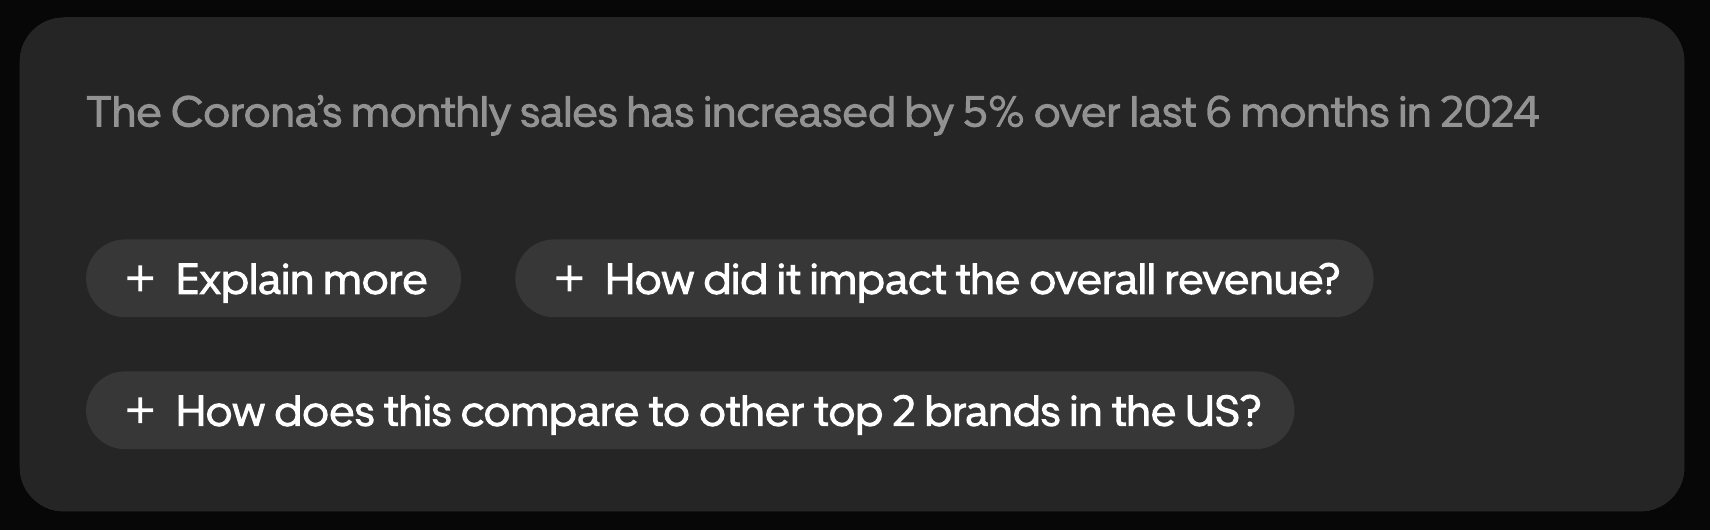
The goal wasn't an answer machine, it was a smart co-worker that helps users move forward with an actual decision. Every response could branch into a next question.
- Explain more→Deeper context on the same answer
- How did it impact revenue?→Connects the insight to a business outcome
- How does this compare to top 2 brands?→Extends the analysis outward
Post-Launch Findings
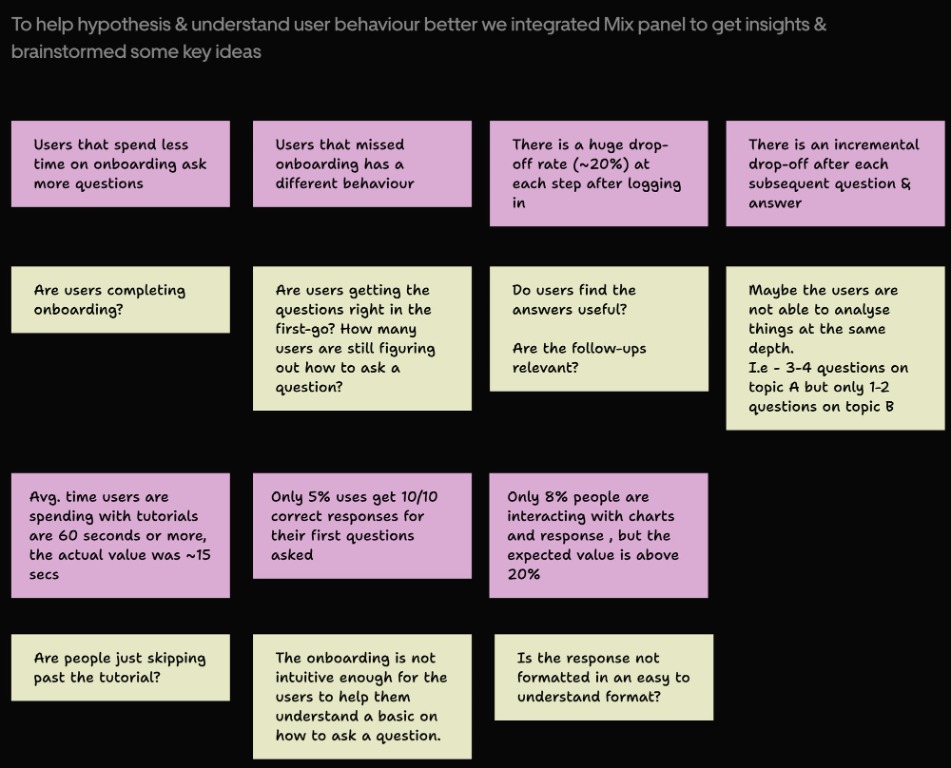
The MVP shipped, and usage data told a different story than expected: a massive number of drop-offs, with people not using the product the way it was designed to be used. That gap became the next design brief.
Asking the right questions
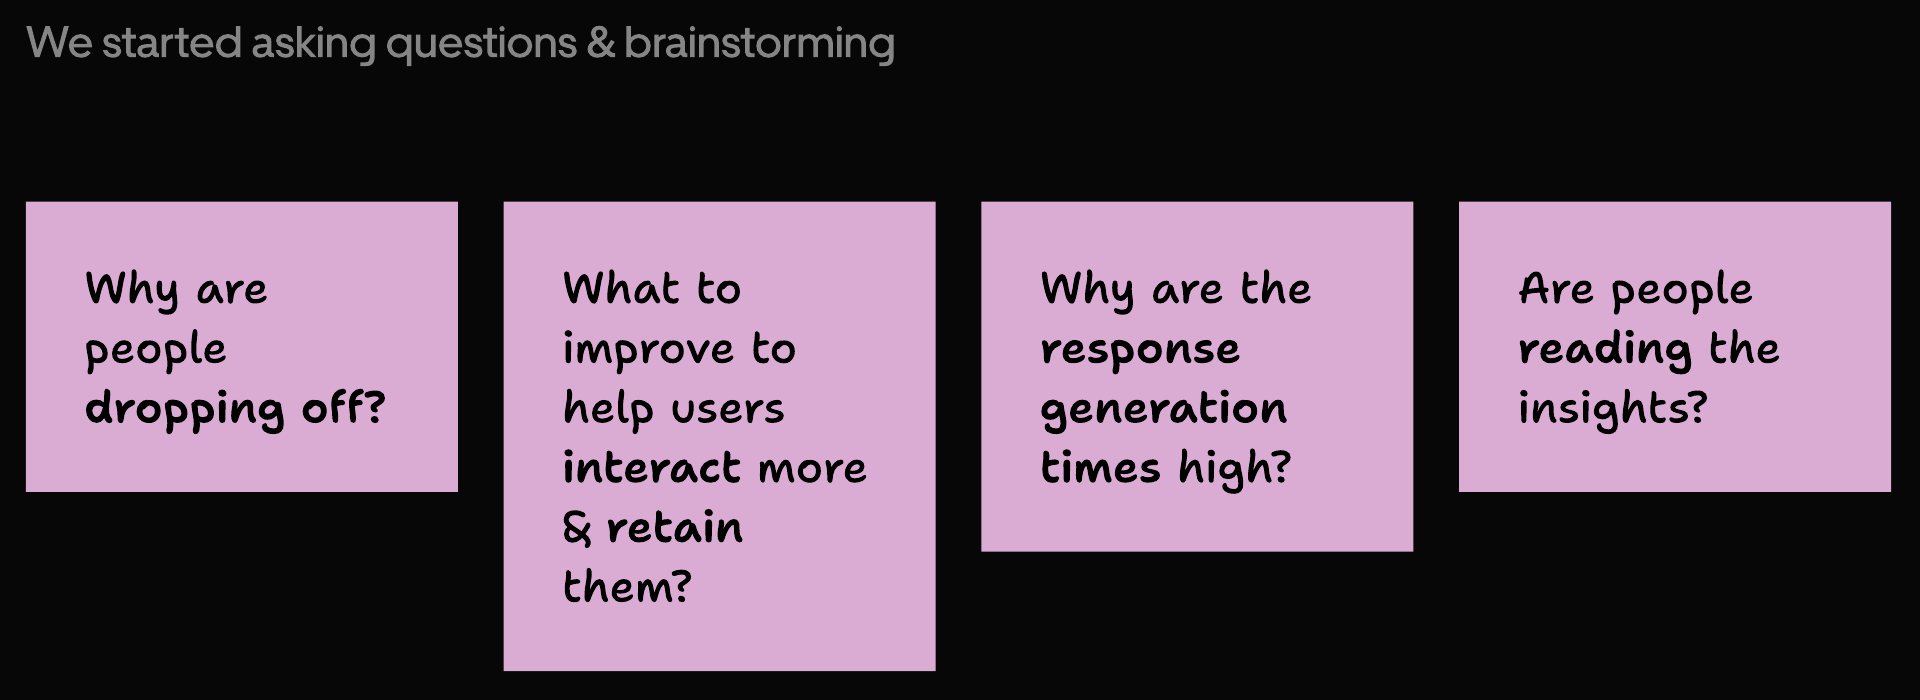
Mixpanel was integrated to test hypotheses about user behaviour, structured around four questions:
- Are users completing onboarding?
- Are users getting questions right on the first try?
- Do users find the answers, and the follow-ups, useful?
- Why are response generation times high?
What the data actually showed
- Tutorial engagement→~15s spent vs. 60s intended
- First-question accuracy→Only 5% got a fully correct response
- Chart interaction→8% engaged, vs. an expected 20%+
- Drop-off per step→~20% at every step after login
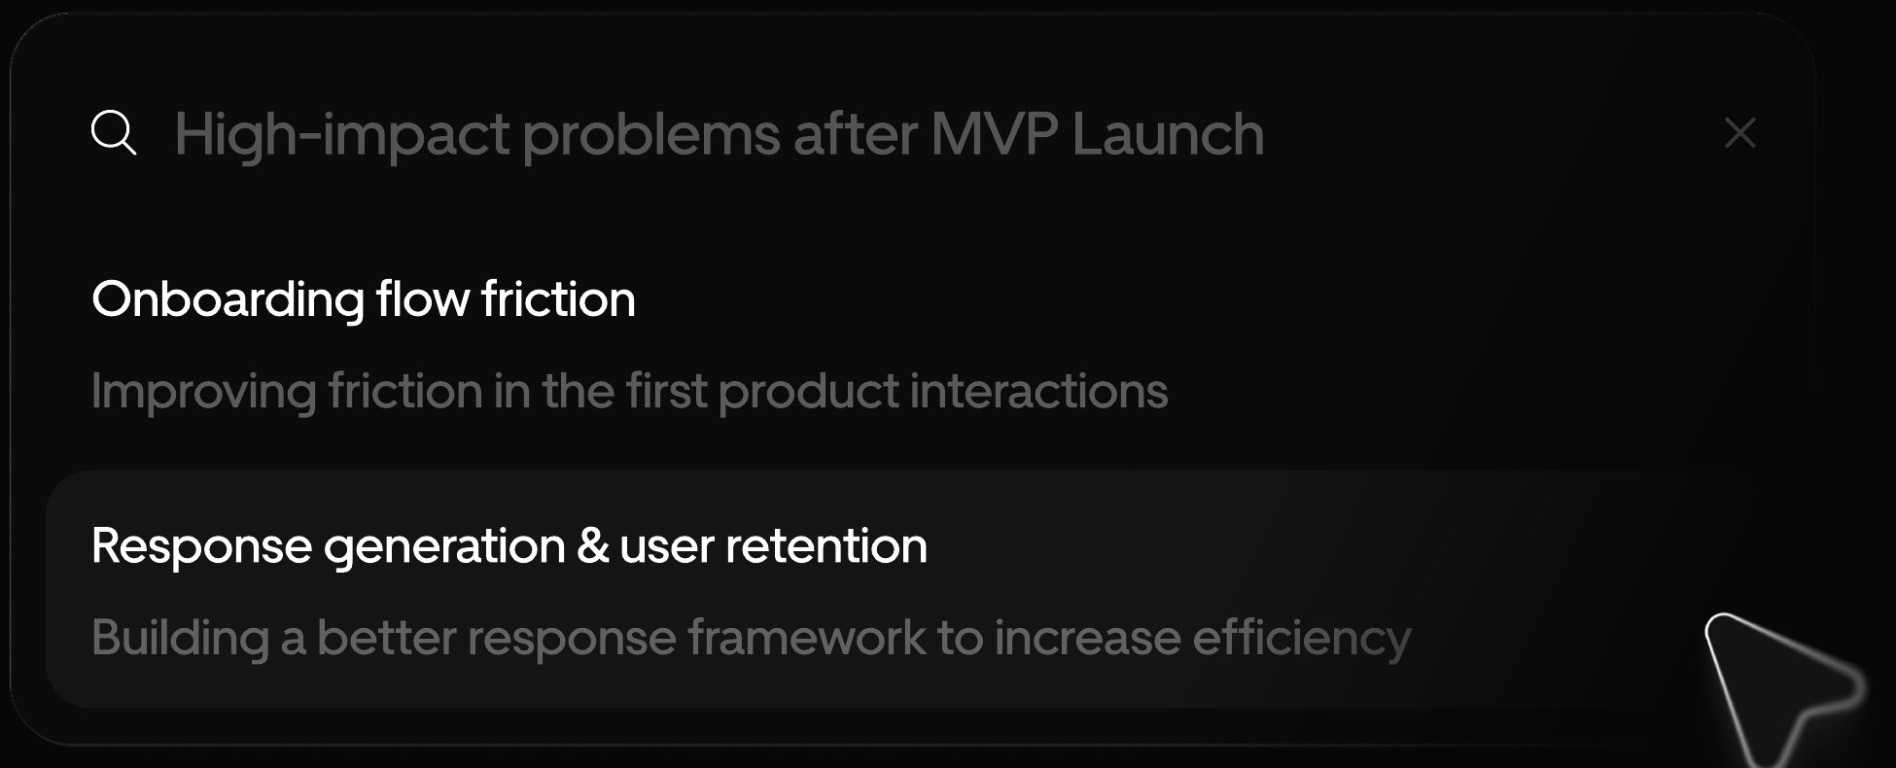
Two high-impact problem areas came out of this: onboarding flow friction, and response generation & user retention — the two threads the rest of this case study follows.
Onboarding Redesign
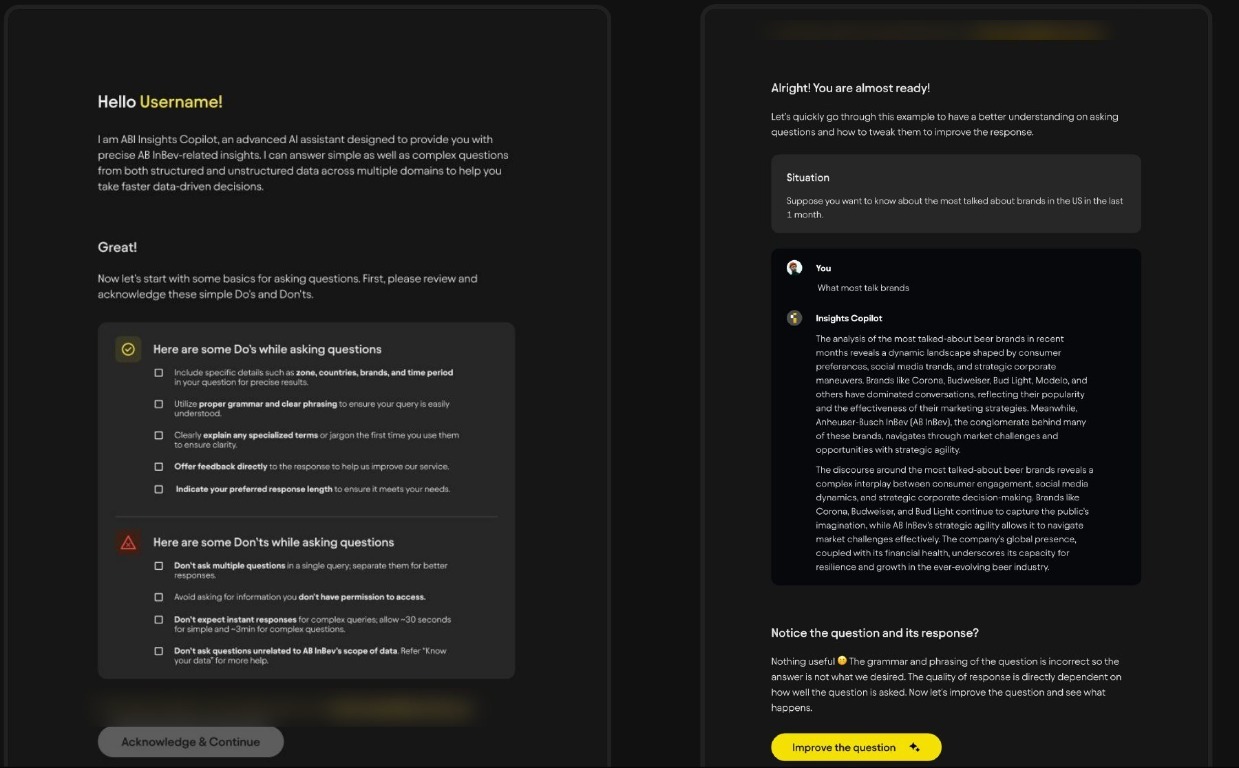
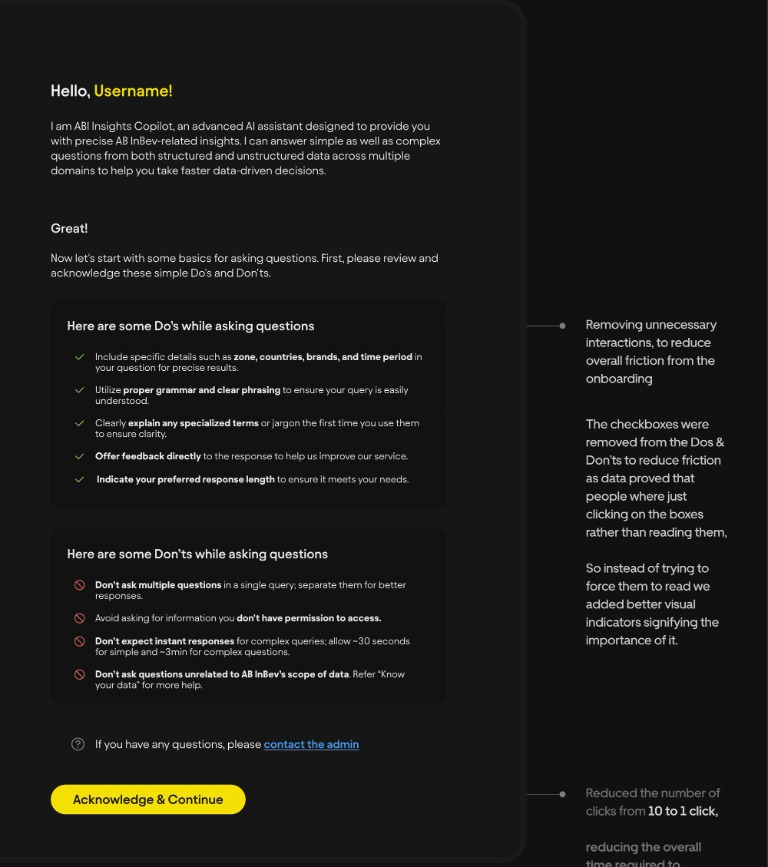
Using data to redesign onboarding and tutorials. In the early version, onboarding looked simple but felt tedious. Users clicked through multiple screens, checkboxes, and confirmations just to reach the product. It wasn't the content that lost them, it was the sheer number of interactions before they could do anything meaningful.
Hypothesis & insights
Users were skipping onboarding because they wanted faster access, not because the content was wrong. Each metric from the findings above became its own design trigger, pointing at interaction overload rather than confusing content.
Approach
- Reduce the number of clicks and interactions, overall friction first
- Short, relevant examples for context-setting instead of abstract instructions
- Remove per-item checkboxes from the Do's and Don'ts, replace with one universal Agree button
Process
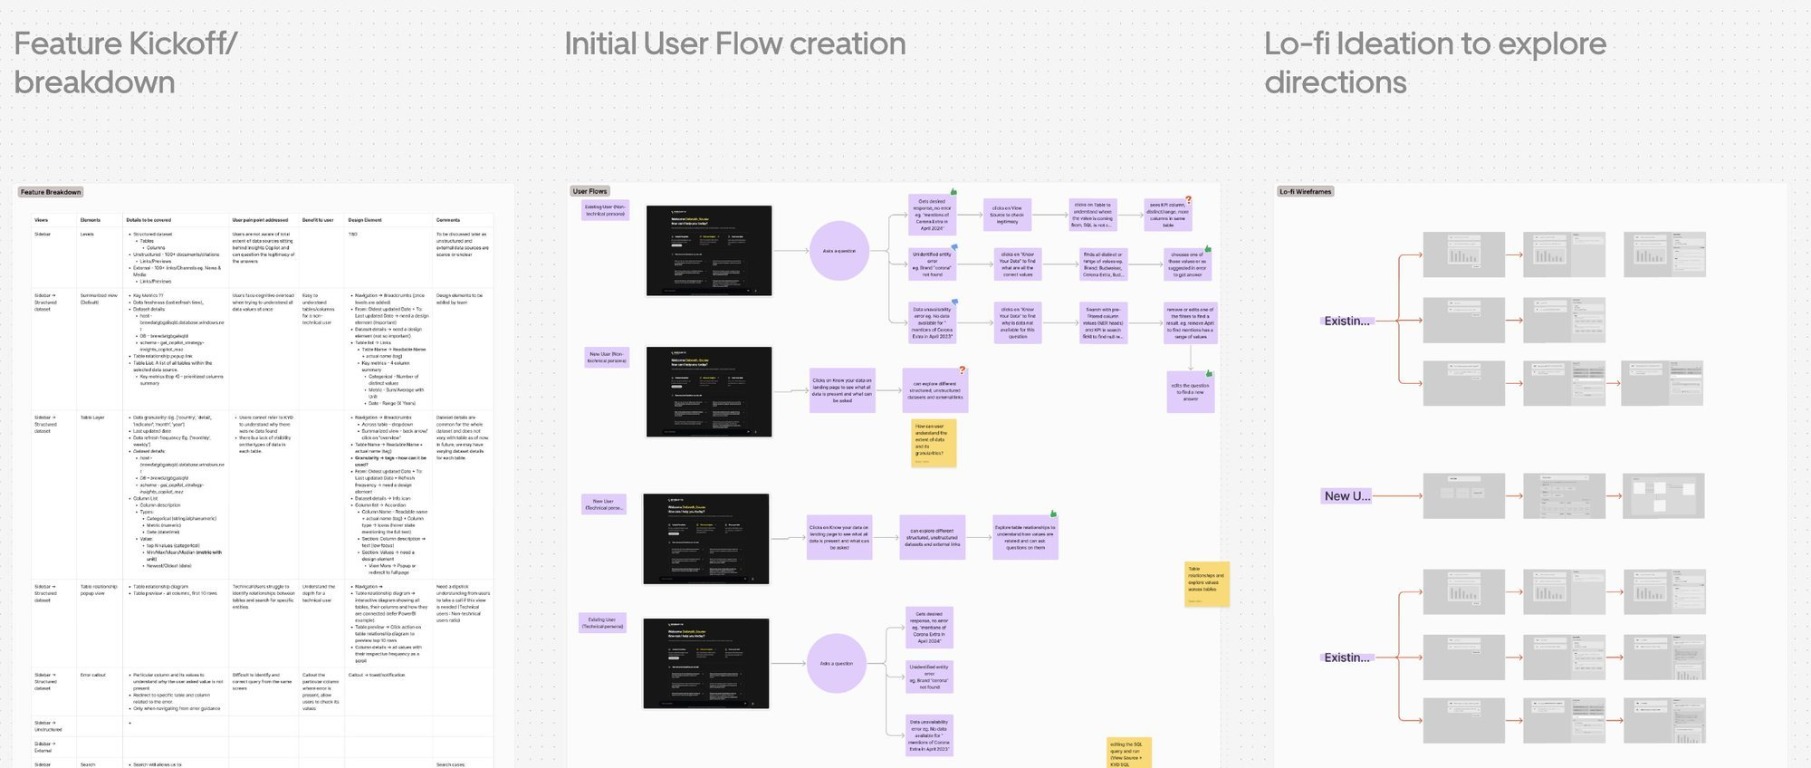
Kickoff
Aligned with PM and devs on scope.
Lo-fi
Explored directions before committing to detail.
UAT
Validated assumptions with a small sample via Maze.
Launch
Shipped the reduced-friction flow.
Iteration
Kept refining nudges and pacing after launch.
Minimising nudges
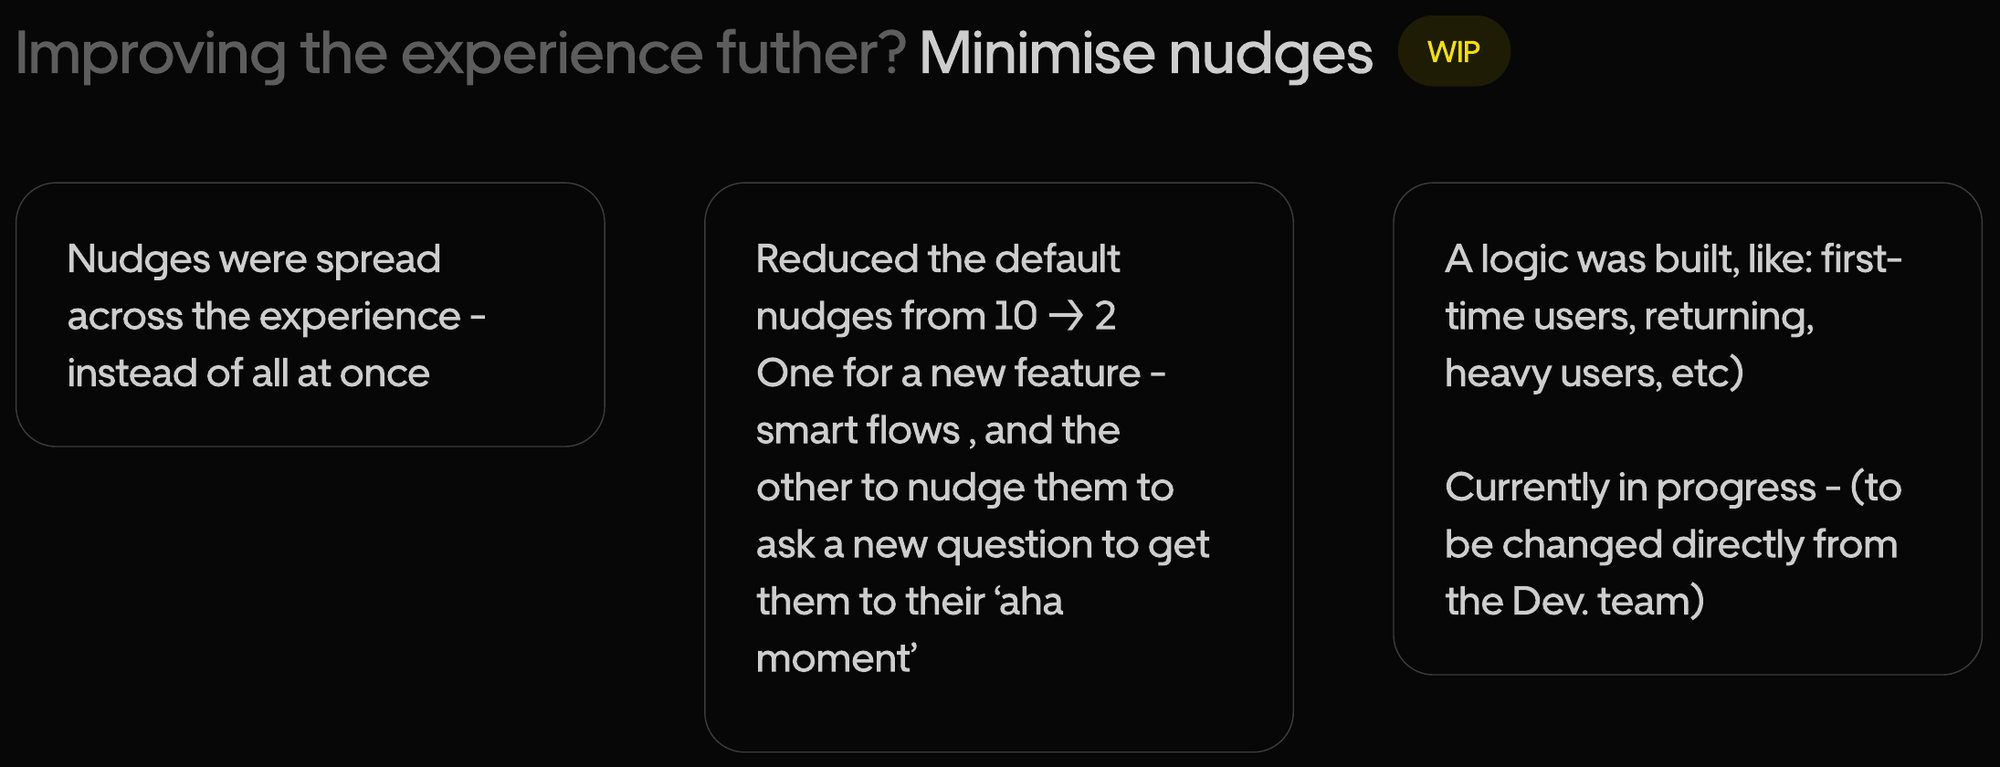
Nudges were originally bunched together instead of spread across the experience. They were reduced from 10 default nudges down to 2: one introducing Smart Flows, and one prompting a new question to get users to their first "aha" moment faster. A fallback nudge was added separately for domains where advanced features weren't set up yet, so users got an honest "this is still being configured" message instead of a dead end.

Impact
10 clicks
To get through onboarding, before reaching anything useful.
1 click, ~30s
Average completion time dropped accordingly, and drop-off fell significantly at every step.
Why question quality matters
A large part of onboarding was teaching people to ask better questions, since the quality of a question directly determined the quality of the answer.
"What are the most talked about brands?"
No geography or time period. The response can't be interpreted clearly.
"...in the US in the last 1 month?"
Better, but still ambiguous on which brands actually qualify without a fuller filter.
"...owned by Heineken, in the US, last month?"
A precise, well-scoped question returns a precise, usable answer.
Outcomes
- Onboarding became smoother and noticeably faster
- The activation metric ("ask your first question") improved
- Retention improved after onboarding completion
Smart Flows
Turning repetitive analysis into guided, reusable workflows. In the early version, users could explore data freely, but every new analysis meant starting from zero. Switching between brands, markets, or business questions meant rebuilding the entire flow each time.
Key problems
- Analysis lacked continuity: each query existed in isolation
- Constant repetition made exploration slow, fragmented, and effort-heavy
Research & inference
Through user sessions and interviews, a recurring pattern emerged: analysts weren't struggling to find data, they were struggling to repeat analysis efficiently. They saved screenshots, copied prompts, and built side documents just to replicate similar analyses for different scenarios. The real problem wasn't what they were asking. It was how often they had to rebuild the same structure to ask it.
If we guide users based on recurring patterns, they can spend less time setting up and more time gaining insights.
Solution: pre-built templates
Smart Flows combine relevant queries into a single, reusable path, letting teams run consistent analyses across brands and categories without rebuilding context each time. A repetitive task became a guided process that scales across use cases.
How it works
Pick a Smart Flow card
The chat bar auto-populates with a matching query template.
Fill in the pills
Users click each pill and choose from a dropdown to complete the template.
Send the query
Copilot recognises the key KPIs embedded in the template and starts the flow.
Get the full report
5-15 minutes later, depending on complexity, with an in-depth, fully drilled-down analysis of the subject.
Results & Reflection
Both threads traced back to the same root cause: friction, whether at the door (onboarding) or mid-task (repeated analysis), was the real drop-off driver, not the underlying AI capability itself.
Data is crucial to the design team to make a stand on a non-design-mature domain inside the company.
Trust and simplicity go hand in hand for users.
Next steps
A personalization logic is in progress, tailoring the experience for first-time, returning, and heavy users differently. It's currently being handed to the dev team to implement directly.